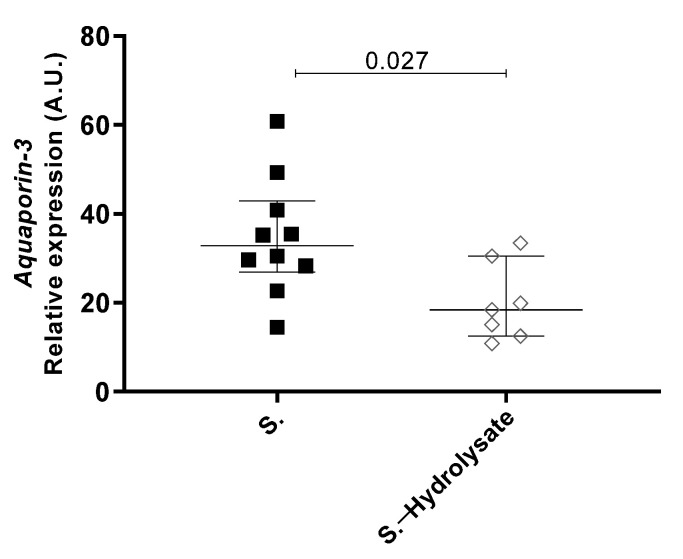
Figure 4.
Effect of supplementation with the hydrolysate on aquaporin-3 gene expression in the skin. Murine aquaporin-3 mRNA expression level was measured at the site of Af-exposure. Data are expressed as median ± interquartile range with n= 8 for non-supplemented mice (S.) and n = 7 for the mice supplemented the hydrolysate (S.—hydrolysate).

