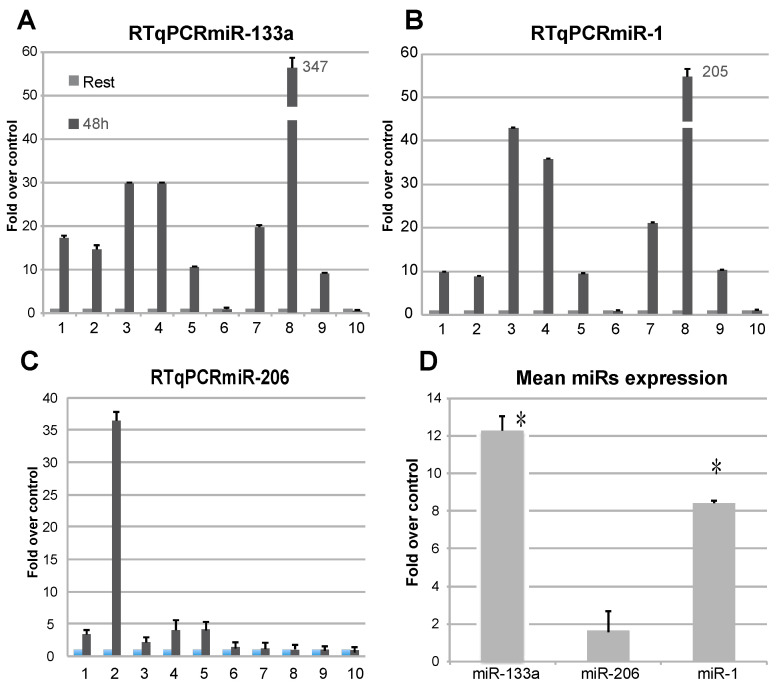
Figure 1.
Analysis of the presence of c-myomiRs from RNA extracted from plasma subjects. Levels of miR-133a (A), miR-1 (B), and miR-206 (C) were analysed by RTqPCR and presented as fold-over-control. Upregulation of miR-133a is detectable in most of the probands. The miR-206 seems not be widely regulated in this context. A mean value of expression was calculated for the presented miRs (D), showing miR-133a as the most upregulated. (n = 3, * p < 0.01 t-test, two tails, equal variance).

