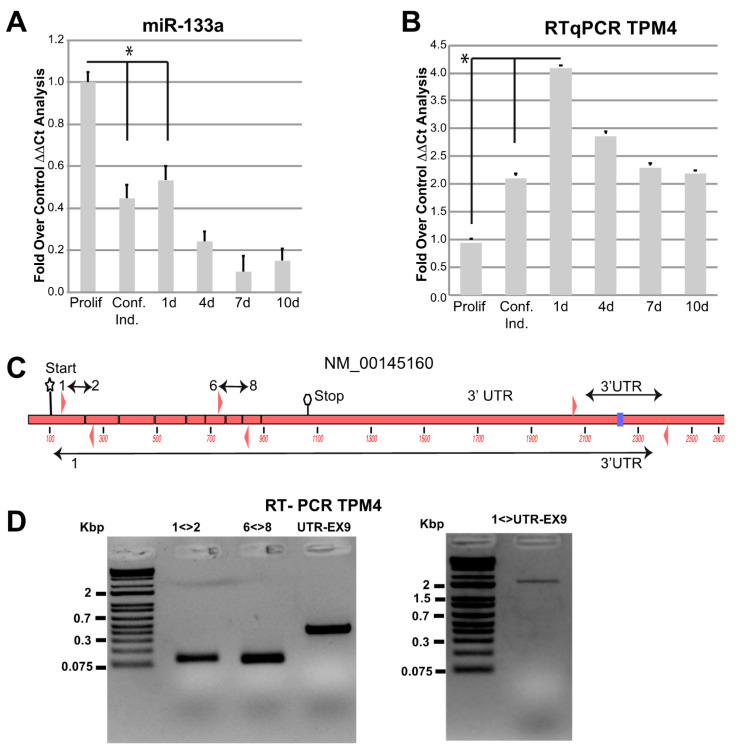
Figure 3.
miR-133a and TPM4 expression. miR-133a (A) and TPM4 (B) expression during myocyte differentiation was analysed by RTqPCR, values were expressed as fold over control. The ΔΔCts were calculated by using housekeeping transcript (actin and GAPDH), and all data were normalised on the proliferating cells condition (n = 3, * p < 0.01, t-test two tails, coupled). (C) Structure of TPM4 with primers amplifying different combinations of exons and of the 3′ UTR (NCBI identification number NM_001145160.1). (D) Results of the RT-PCR showing the amplification of the full-length transcript including the 3′ UTR (DNA marker: Thermo Scientific™ O’GeneRuler 1 kb Plus DNA Ladder).

