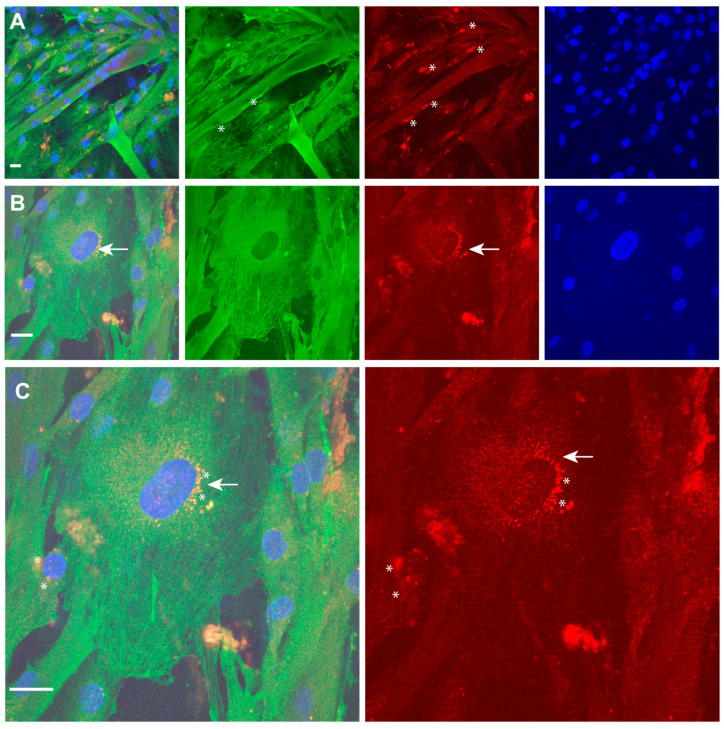
Figure 6.
TPM4 and p63 expression in differentiating myocytes. (A,B) Identification of p63 (red) positive nuclei in differentiating myocytes. Only some mono-nucleated cells (stars) are positive. (C) Enlargement of mononucleated cells shows fibrillar distribution of TPM4 (green) and perinuclear localisation of p63 (red), probably identifying the time of the transport from ER to nucleus (arrow and stars). DAPI (blue) was used for nuclei staining. Laser wavelengths as the previous figure. Bars = 10 µm.

