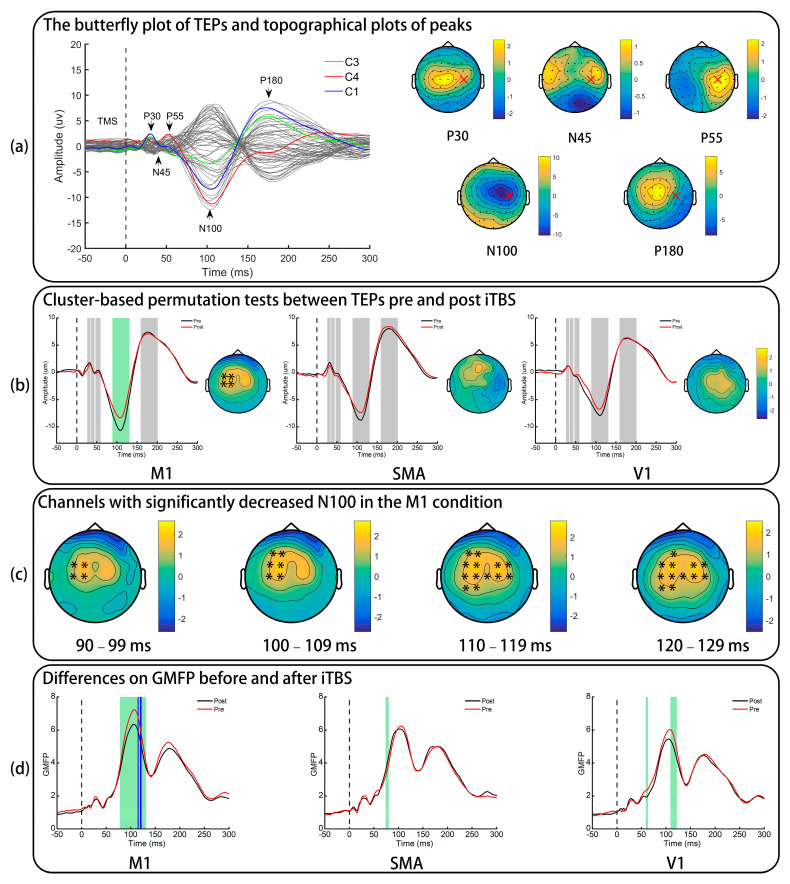
Figure 2.
The effect of iTBS in TMS-evoked potentials. (a) Only pre-iTBS data of the M1 condition are presented. “x” indicates the stimulation site. (b) TEP difference of a representative electrode (FC1). The grey shadows indicate the predefined time windows of five peaks and the green shadow indicates the significant difference in the N100 of M1 TEPs. Topographical plots are the difference of N100 amplitudes () and “*” represents electrodes with a significant difference. (c) “*” represents electrodes with a significant difference induced by iTBS to the M1 in four small time windows of N100. (d) The global mean field power pre- and post-iTBS. Green shadows indicate a significant difference identified by paired t-tests and the blue shadows indicate comparisons survived after FDR corrections were applied. TEPs: TMS-evoked potentials; iTBS: intermittent theta burst stimulation; M1: primary motor cortex; SMA: supplementary motor area; V1: primary visual cortex; GMFP: global mean field power.

