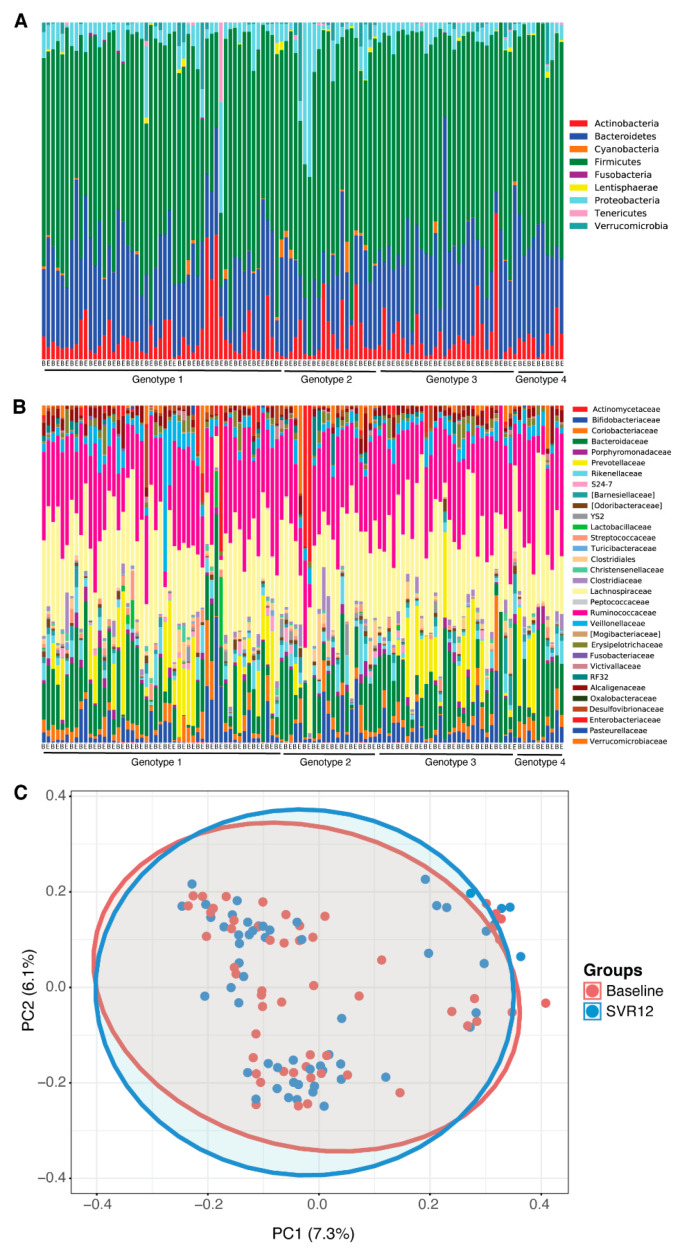
Figure 1.
Microbial differences before treatment (baseline) vs. SVR12 groups. Taxonomy profile of patients at baseline and 12 weeks after the end of the treatment are shown (A) at phylum level and (B) at family level. (C) Microbial clustering is shown based on generalized UniFrac metrics using fecal DNA samples at baseline and SVR12. Non-parametric analysis of variance (Adonis) was used to test significant differences between groups on the PCoA plot, with a result of p > 0.05. The ellipses represent a 95% CI surrounding each disease group. B = baseline; E = end of treatment; PC = principal component; PCoA = principal coordinate analysis; SVR12 = sustained virologic response 12 weeks after the end of the treatment.

