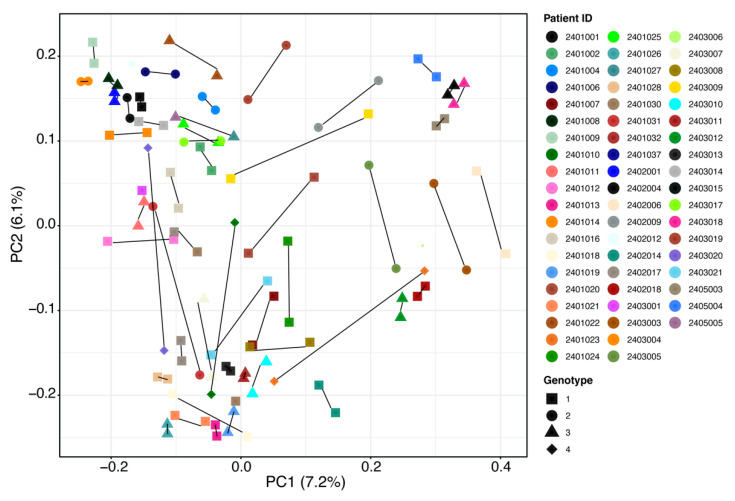
Figure 3.
Overall beta-diversity differences before treatment (baseline) vs. SVR12 groups by patient and HCV genotype. Notable outliers with considerable changes are circled in red. Examples of minimal change are circled in blue for comparison. Non-parametric analysis of variance (Adonis) was used to test significant differences between groups on the PCoA (principal coordinate analysis) plot with a result of p > 0.05. SVR12 = sustained virologic response 12 weeks after the end of treatment.

