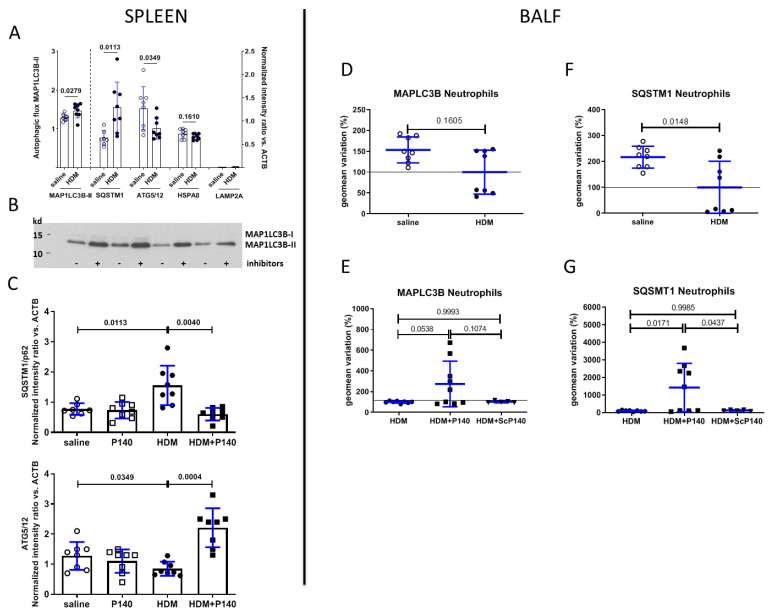
Figure 5.
Measurement of autophagy markers in total splenocytes and BAL neutrophils collected from mice from HDM-sensitized and challenged mice. Nine-week-old female BALB/c mice were sensitized and challenged intranasally as indicated in Figure 2A. They receive vehicle, P140 or ScP140 intravenously at day 22; BALFs and spleens were collected at day 31. (A,B) Western immunoblotting and semi-quantification of five autophagy markers present in the spleen extracts from mice that received saline only or that were sensitized and challenged by HDM, and were treated or not with P140 (n = 8 in each group). The data are presented as the mean ± SEM. In (A), the autophagic flux (left part) corresponds to the ratio of MAP1LC3-II protein expression found in cells incubated in the presence or absence of bafilomycin A1. In (A) (right part) and (C), the expression of the other proteins, as measured by densitometry of Western blots, was normalized with regard to the β-actin/ACTB level. (D–G) Flow cytometry semi-quantification of autophagy markers present in the neutrophil population present in the BALF from mice that received saline only or that were sensitized and challenged by HDM with or without treatment with P140. Two markers were tested, namely MAP1LC3B (D,E) and SQSTM1 (F,G). The results generated with other cell types are shown in the Figure S2. The data are represented as the mean variation ± SEM of the geomean (in%). The horizontal lines indicate the 100% level. Saline, n = 8; HDM, n = 8; HDM + P140, n = 9; HDM + ScP140, n = 5. Pooled data from 2 independent experiments.

