Figure 5.
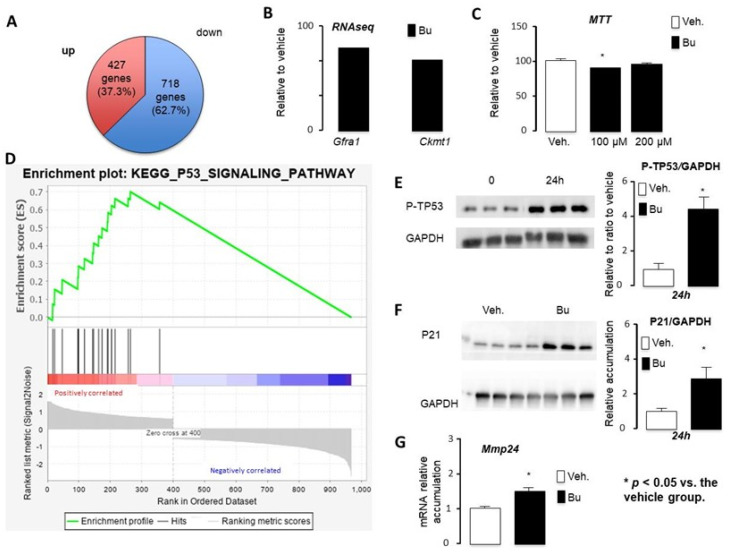
The RNAseq approach defined key targets of busulfan in the GC1spg cell line. (A) Venn diagram for differentially expressed genes in GC1spg cells tr eated for 24 h with vehicle or 200 μM Bu. (B) Fold change of Gfra1 and Ckmt1 obtained from the RNAseq data. (C) MTT data for the GC1spg cells treated for 24 h with vehicle or 100 μM or 200 μM Bu. (D) GSEA data obtained for genes differentially expressed in Bu- vs. vehicle-treated GC1spg cells. (E) Representative Western blots of GAPDH and Phospho-TP53 (P-TP53) and quantification of ratios in GC1spg cells treated with vehicle or Bu for 24 h. (F) Representative Western blots of GAPDH and P21 and quantification of ratios in GC1spg cells treated with vehicle or Bu for 24 h. (G) Relative Mmp24 mRNA accumulation normalized to β-actin on GC1spg cells treated for 24 h with vehicle or 200 μM of Bu. Veh.: vehicle and Bu: busulfan. * p < 0.05, vs. the vehicle group. Veh.: vehicle and Bu: busulfan.

