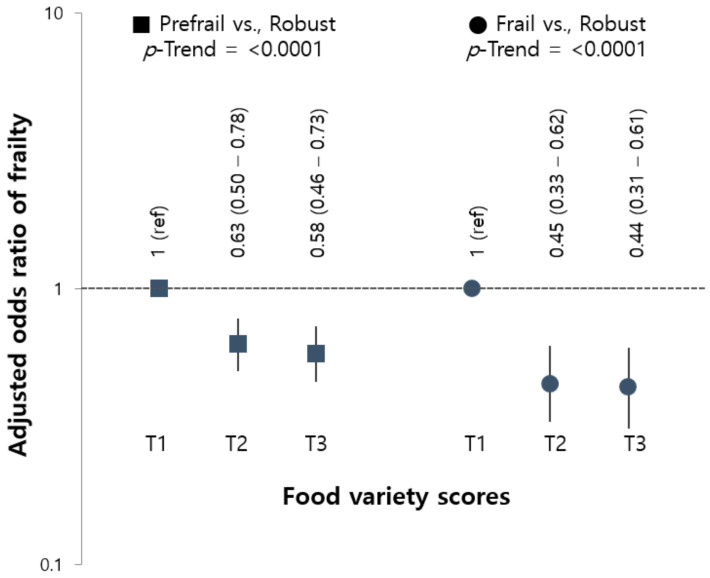
Figure 1.
Adjusted ORs (95% CI) for pre-frailty and frailty according to the tertile of food variety scores. Ref.: reference category; OR: odds ratio; CI: confidence interval. Data were calculated using the multinomial SURVEYLOGISTIC model. ORs (95% CIs) were adjusted for gender, age, BMI, living status, residential area, family income, education level, smoking status, high-risk alcohol consumption, comorbidity, and energy intake.

