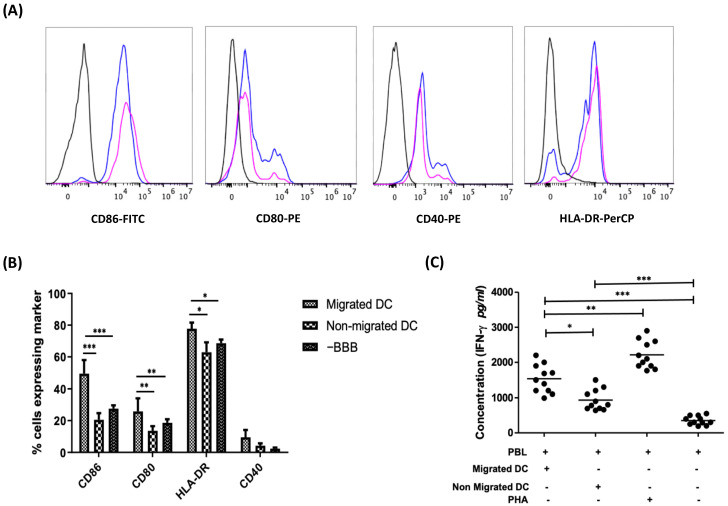
Figure 2.
BBB-transmigratory DCs display a more activated state as compared to their non-migrating counterparts and when compared to the migrating DCs in the absence of BBBs. (A) Representative figure showing the expression of co-stimulatory markers of migrating DCs (blue peak) and non-migrating dendritic cells (pink peak) as compared to their respective isotype controls (black). The count numbers of these cells are provided in Table S1 of the supplementary information (Table S1). (B) The expression of the activation markers CD80, CD86, HLA-DR, and CD40 on migrating vs. non-migrating DCs following a chemotaxis assay in an in vitro BBB model was evaluated along with the comparison against a control sample in the absence of BBB. Migrated DCs demonstrate a significantly higher expression of CD80, CD86, and HLA-DR as compared to non-migrated DCs (n = 6) and the DCs migrating in the absence of BBB (n = 3). (C) DCs that migrate across an in vitro model of the BBB demonstrate stronger T cell-stimulatory capacity as compared to non-migrating DCs, as shown in an allo-MLR (n = 11). (* p < 0.05; ** p < 0.01; *** p < 0.001).

