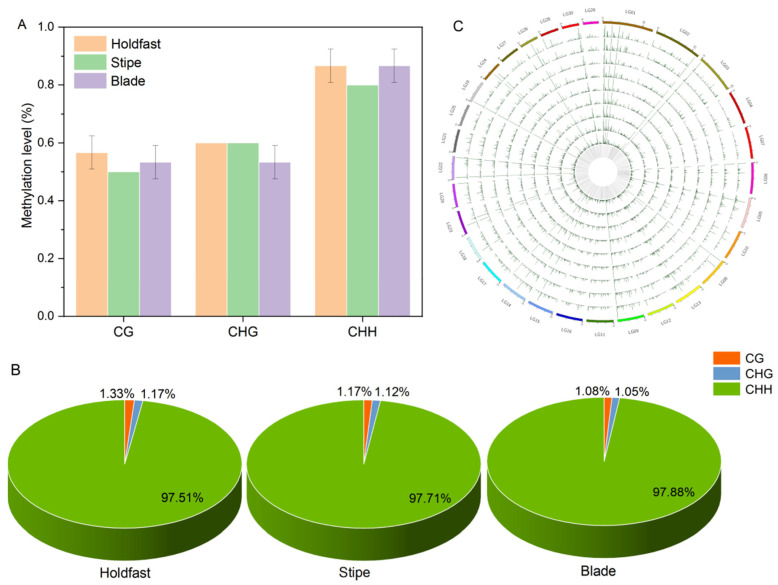
Figure 1.
Whole-genome DNA methylation status and chromosomal distribution of S. japonica sporophytes. (A) DNA methylation levels in holdfast (navajo white), stipe (light green) and blade (medium orchid). (B) The relative content of methylated cytosines in CG (dark orange), CHG (cornflower blue) and CHH (lime green) contexts. (C) The landscape of DNA methylation in the 31 chromosomes of sporophyte. From outside to inside, the outermost circle is the scale divided according to the corresponding chromosome length. The following nine circles show the genome-wide landscape of DNA methylation in blade (B3–B1), stipe (S3–S1) and holdfast (H3–H1). The innermost circle indicates the gene numbers in the corresponding region. The higher the lines, the higher the methylation levels. B, H and S are the samples of blade, holdfast and stipe, respectively.

