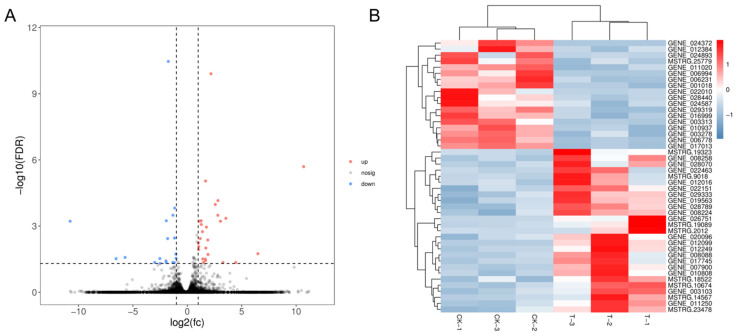
Figure 7.
Effects of 5-AzaC treatment on the transcriptome of sporophytes. (A) The volcano plot of different expression genes (DEGs) present, in which blue dots indicate down-regulated genes and red dots indicate up-regulated genes in response to 5-AzaC treatment. (B) Cluster analysis of differential expression genes. Each row represents one DEG, and the color gradually changes from blue to red, indicating the shift of gene expression level from low to high. CK represents the control group, and T represents the 5-AzaC treatment group.

