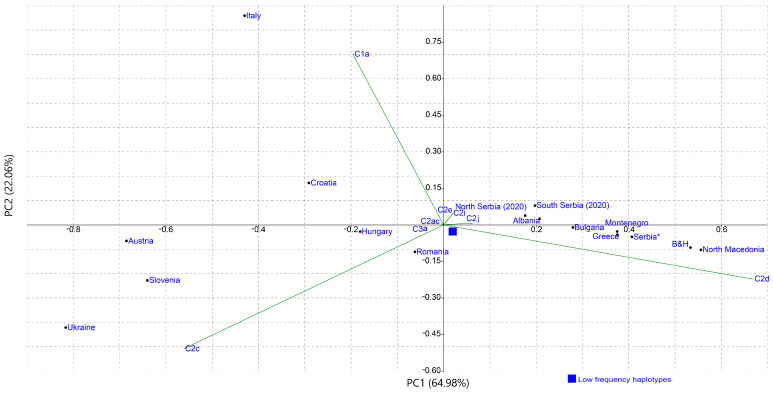
Figure 6.
PC analysis based on mtDNA haplogroup frequencies in different A. mellifera populations. The contribution of each haplogroup to the PCs is shown with green lines. Frequencies of mtDNA haplogroups and references are listed in Tables S2 and S6.

