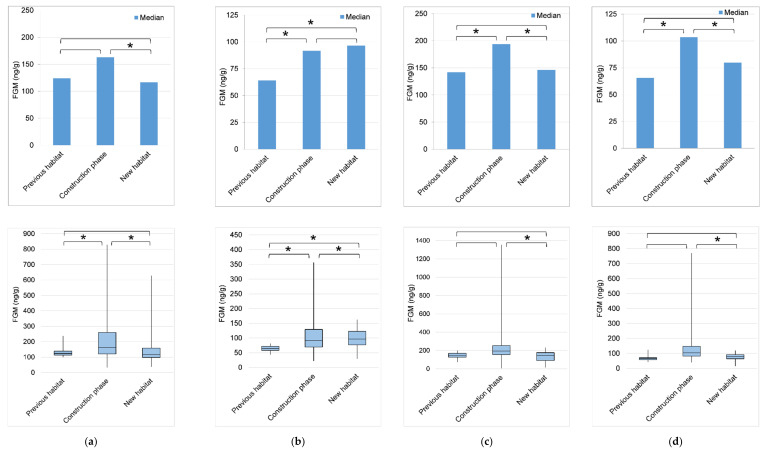
Figure 5.
Comparison of median and variability (inter-quartile range and range) fecal glucocorticoid metabolite (FGM) concentrations between the previous habitat, the construction phase, and the first year in the new habitat. (a) Female 1; (b) Female 2; (c) Female 3; (d) M-juvenile. Asterisk (*) indicates a statistically significant difference between habitat phases.

