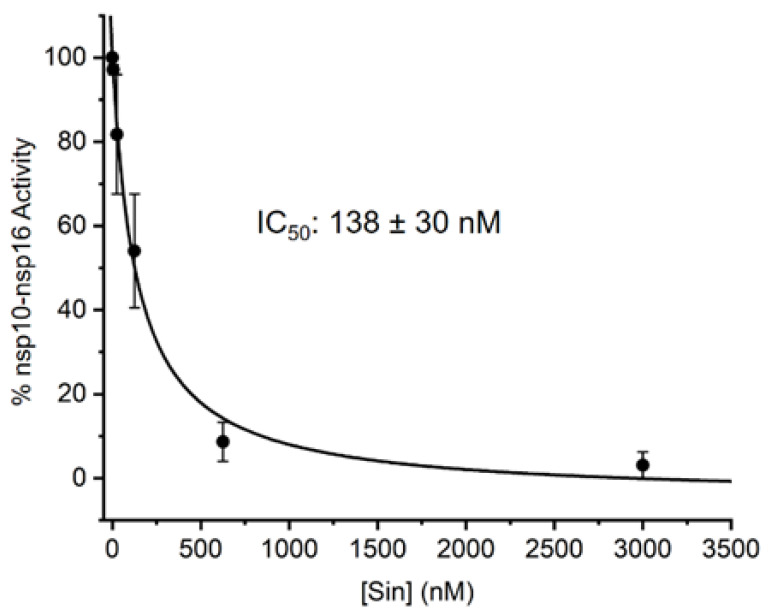
Figure 4.
Inhibition curve of Sinefungin. Capped m7Gp3A-RNA was treated with nsp10-nsp16 and SAM at various concentrations of Sinefungin. After reaction, RNA was cleaved by nuclease P1 and analyzed, and the dimethylated cap (m7Gp3Am) was quantified by LC-MS. The measurement was performed in triplicate.

