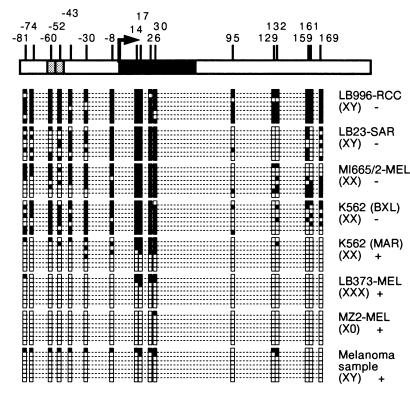
FIG. 2.
Methylation pattern of MAGE-A1 in tumor cells. The 5′ region of the gene is represented at the top with a broken arrow at the transcription start site, vertical bars at the locations of CpG dinucleotides, and two gray boxes representing the two Ets binding sites of the promoter. For each tumor, the methylation pattern of eight DNA molecules is shown. Black squares correspond to methylated cytosines; empty squares correspond to unmethylated cytosines. For each cell line, the content in X chromosomes and the presence (+) or absence (−) of MAGE-A1 expression are indicated. LB996-RCC is a renal cell carcinoma; LB23-SAR is a sarcoma cell line; MI665/2-MEL, LB373-MEL, and MZ2-MEL are melanoma cell lines; K562 (BXL) and K562 (MAR) are two cultures of the same erythroleukemia cell line that have been maintained separately for a long time and differ with respect to expression of MAGE-A1. The melanoma sample was obtained from a lymph node metastasis.

