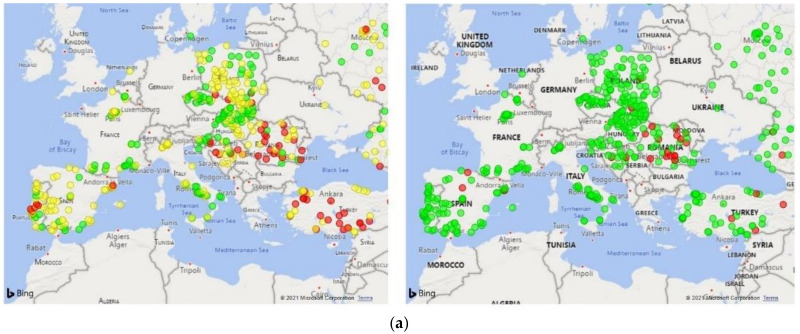
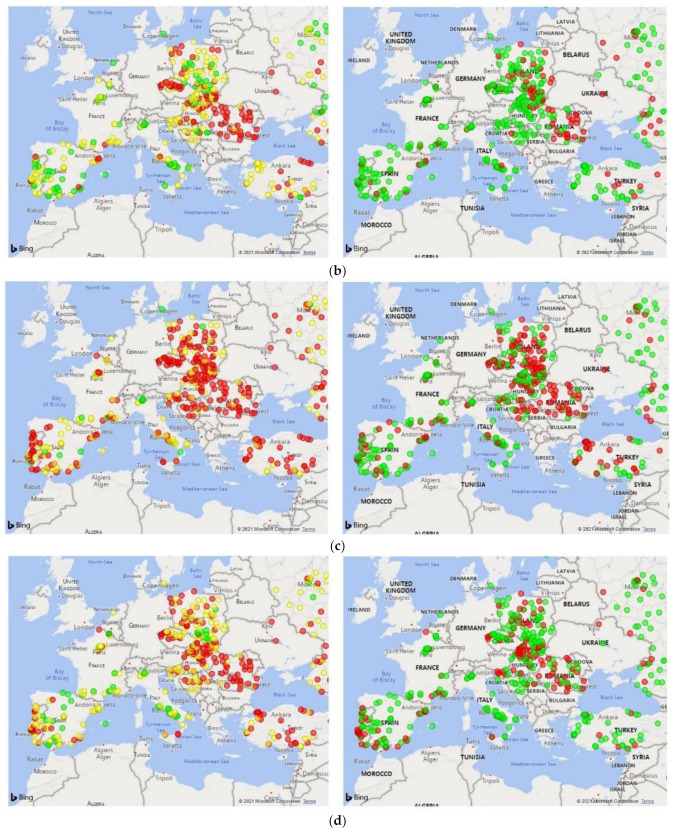
Figure 5.
COVID-19 outbreak risk mapping in European clinics of the Nephrocare network. Geographical risk maps were built considering epidemic data related to the following exemplary dates: (a) 2 August 2020, (b) 4 October 2020, (c) 1 November 2020, and (d) 3 January 2020. Panels on the left show clinic clusters according to the risk of a COVID-19 outbreak occurrence within 2 weeks: Red circles: risk > 12.5%; Yellow, 1.5% < risk ≤ 12.5%; Green, risk ≤ 1.5%. Panels on the right report the actual incidence of COVID-19 outbreaks in the forecasting period.


