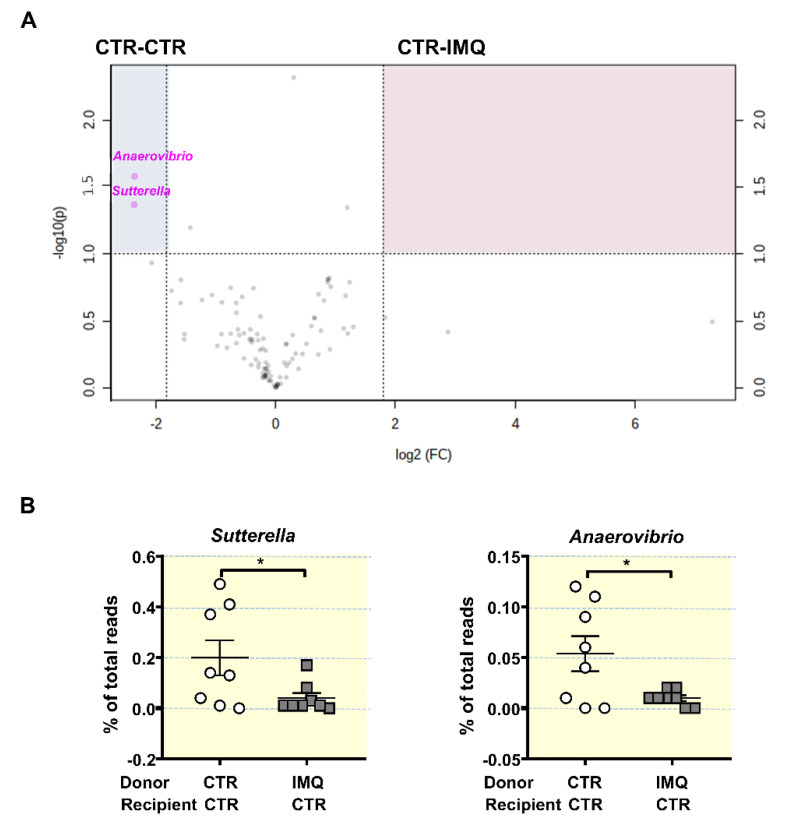
Figure 7.
Effects of stool transplantation from imiquimod (IMQ)-treated mice to control mice at the genera proportion in gut microbiota. (A) Volcano plot displaying significantly enriched genera in CTR-CTR group or CTR-IMQ group. The x-axis is log2 fold change and the y-axis is transformed p-value. Genera not different between cohorts are shown in black. Features selected by volcano plot with fold change threshold 3.5 and t-test with threshold 0.05. Genera more abundant in CTR-CTR are shown in the upper right, blue-shaded quadrant (B) Proportion of key bacterial genera expressed as percentage of total reads. Data is represented as means ± SEM. Unpaired t-test. * p < 0.05 compared to the CTR-CTR group. CTR-CTR, Control mice (CTR) transplanted with microbiota from CTR; CTR-IMQ, CTR transplanted with microbiota from imiquimod (IMQ)-treated mice.

