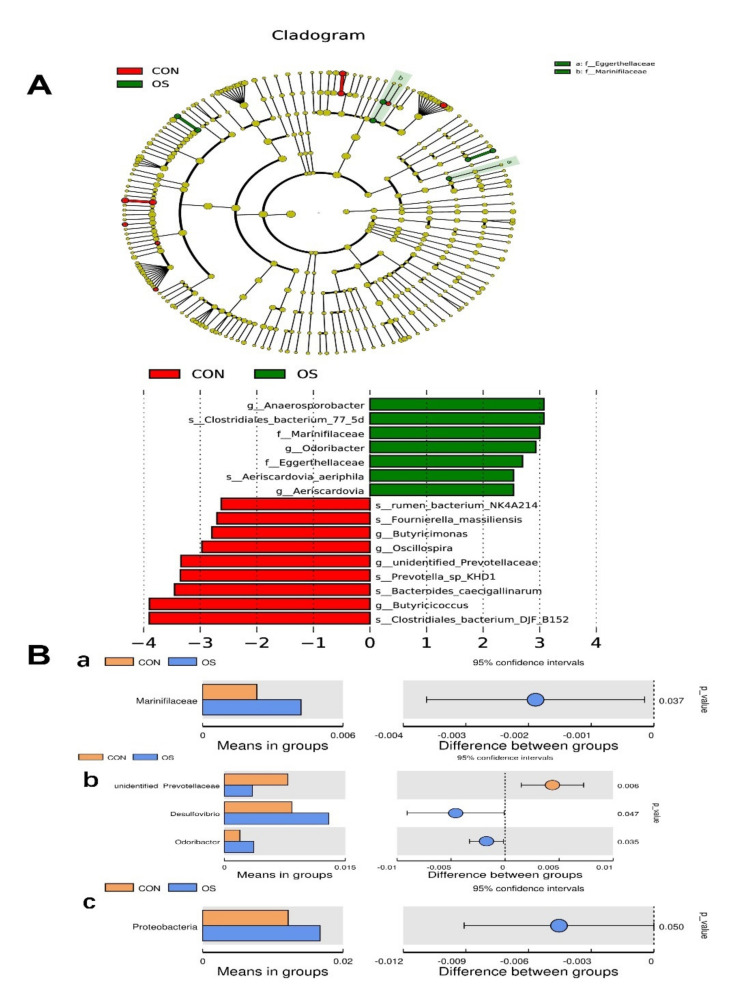
Figure 6.
Oxidative stress (induced by tBHP) changed microbiota enrichment (Experiment 1). Data are means ±SEM represented by vertical bars or plot individual values. (A) Linear discrimination analysis coupled with effect size (LEfSe) identified most differentially abundant taxa in the cecum with LDA significant threshold > 3 were shown. (Red) CON enriched taxa; (Green) OS enriched taxa. (B) Analysis of different species between groups at different levels. (a) Family, (b) Genus, (c) Species. The difference n = 10. Statistical significance was evaluated by the Student’s t-test.

