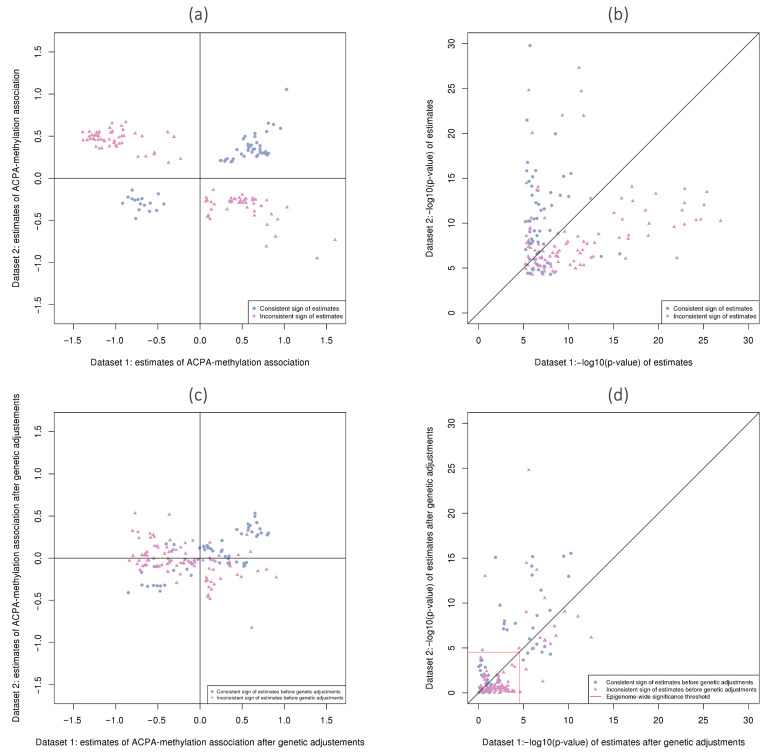
Figure 4.
Scatter plots illustrating agreement between results for the 157 CpGs identified as demonstrating ACPA-methylation associations in both Dataset 1 and Dataset 2. (a) Estimated model coefficients (log odds ratios) from the EWAS binomial regressions. Points are colored in blue if the coefficient signs agree, and in pink otherwise; (b) (p-values) from EWAS binomial regressions; (c) estimated coefficients (log odds ratios) after genetic adjustments; (d) (p-values) after genetic adjustments including lines indicating significance threshold (). Shapes and colors for points in (b–d) correspond to those assigned in panel (a) for intuitive tracking of their changes.

