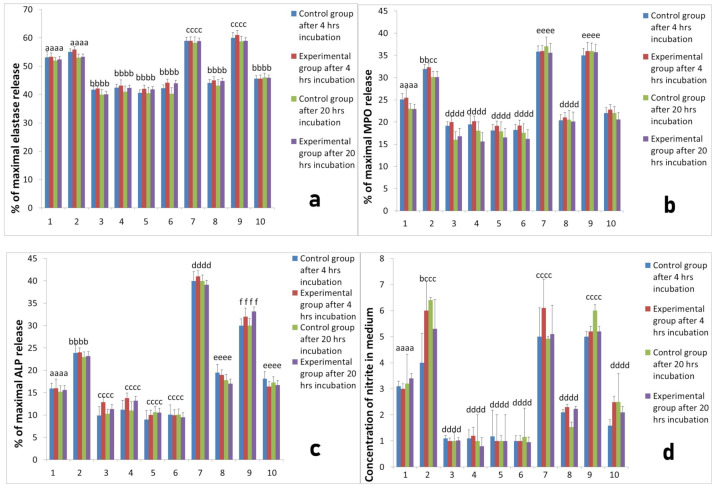
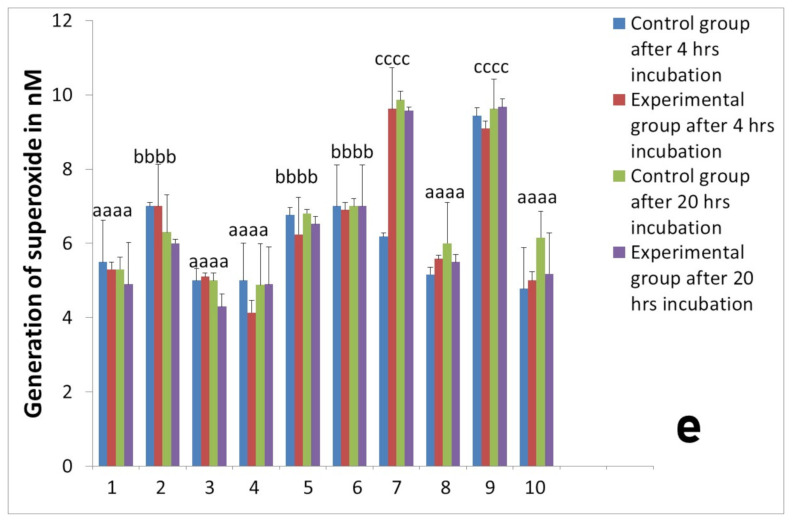
Figure 5.
The response of neutrophils isolated 24 h after implantation with different PRP-derived products with or without additional stimulation with LPS. Cultures were incubated for 4 h or for 20 h at 37 °C and 5% CO2. Data present mean values ± SE of at least three replicates for each bar. The neutrophil response was assessed with respect to: (a) elastase release from neutrophils, (b) MPO release, (c) ALP release, (d) NO generation, (e) superoxide generation. Values marked with different letters differed significantly (p < 0.05). Legends: 1—neutrophil without stimulation, 2—after stimulation LPS, 3—after stimulation PPP from L-PRP, 4—after stimulation PPP from PURE PRP, 5—after stimulation PPP from L-PRP with LPS, 6—after stimulation PPP from PURE PRP with LPS, 7—after stimulation L-PRP, 8—after stimulation PURE PRP, 9—after stimulation L-PRP with LPS, 10—after stimulation PURE PRP with LPS.


