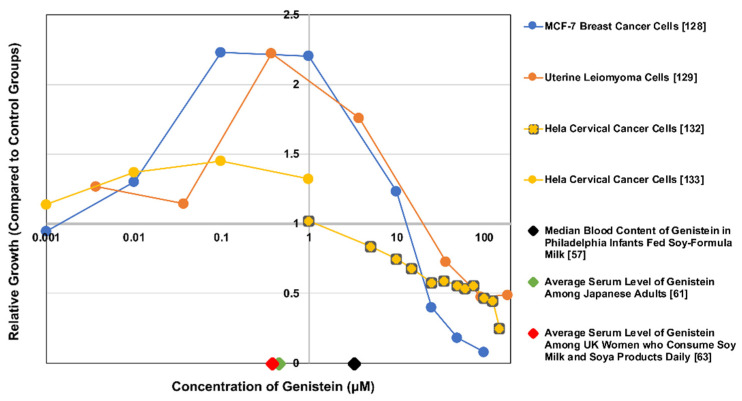
Figure 3.
Relative growth of several cell lines at variable concentrations of genistein overlaid with serum levels of genistein for three populations. Data from [57,61,63,128,129,132,133]. Note that no (0) genistein marks a value of 1 relative growth unit. This is considered the control group for all studies. Also, note that none of the cell lines were reported to be prominent metabolizers of genistein. Concurrently, the serum concentration studies only assessed circulating genistein, while its metabolites (likely the most predominant forms in vivo) would presumably also have effects on the cell lines.

