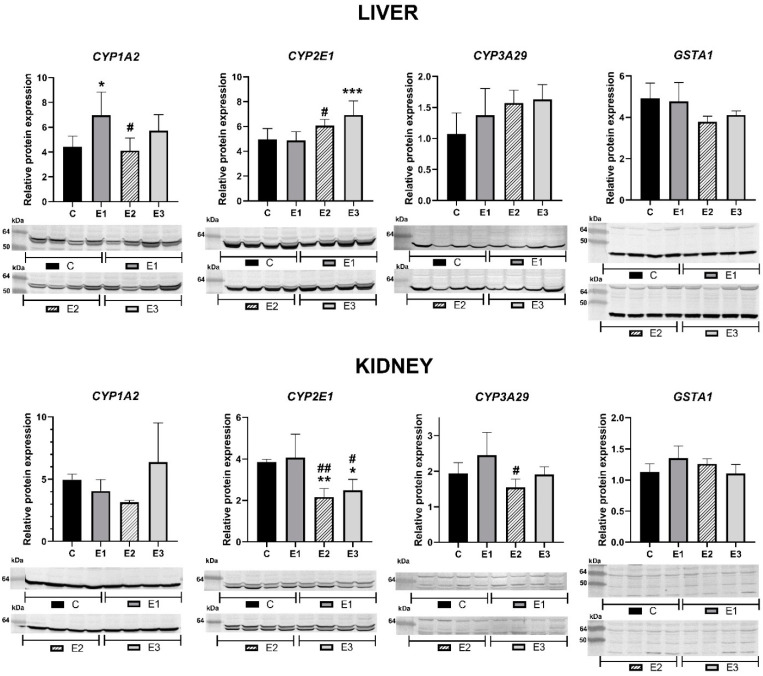
Figure 1.
Relative protein expression and the corresponding quantification of Western blot images for CYP1A2, CYP2E1, CYP3A4 and GSTA1 in the hepatic and renal microsomal fractions of weaned piglets subjected to experimental diets. Calnexin band (70 kDa) was used as reference protein. The control group (C) were fed a basal diet. The experimental groups were fed as follows: the basal diet plus a mixture (1:1) of two byproducts (grapeseed and sea buckthorn meal) (E1 group), the basal diet artificially contaminated with AFB1 and OTA (E2 group), and the basal diet containing the mixture (1:1) of grapeseed and sea buckthorn meal and contaminated with the mix of AFB1 and OTA (E3 group). The data are illustrated as average values of the groups (n = 4) ± standard deviation of the mean (SE) and statistical significance related to the control group level. * E1/E2/E3 vs. C; # E2/E3 vs. E1; *, # p < 0.05; **, ## p < 0.01; *** p < 0.001.

