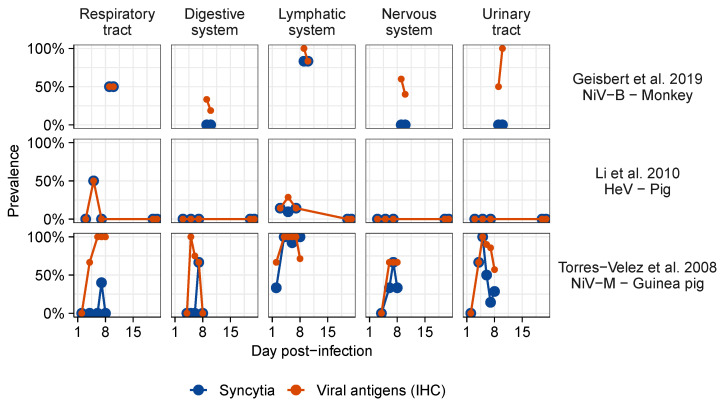
Figure 6.
Proportion of individuals presenting syncytia and viral antigens detected by immunohistochemistry (IHC) over time post-infection following experimental henipavirus infection in vivo. Data from the most complete studies for each virus were selected. Data were extracted from [45,98,106]. The complete dataset showing the temporal patterns of syncytium detection is represented in Figures S5–S7.

