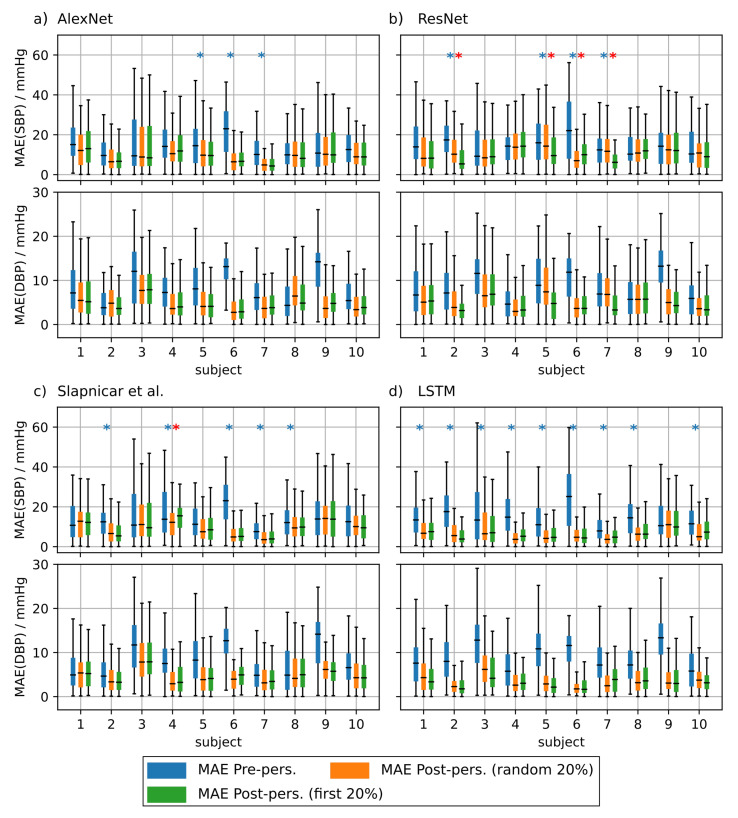
Figure 8.
Mean absolute error (MAE) of the blood pressure (BP) prediction using additional test subjects without personalization (blue boxes), with personalization using randomly drawn training data (orange boxes) and personalization using the first 20% of the test subject’s data for training (green boxes). Blue asterisks denote statistical significant differences between MAE with and without personalization. Red asterisks denote statistical significant differences in MAE between personalization strategies (Kolmogorov–Smirnov test). Only 10 of the 20 tested subjects are depicted in this figure. Results are shown for AlexNet (a), ResNet (b), architecture by Slapničar et al. (c) and LSTM (d).

