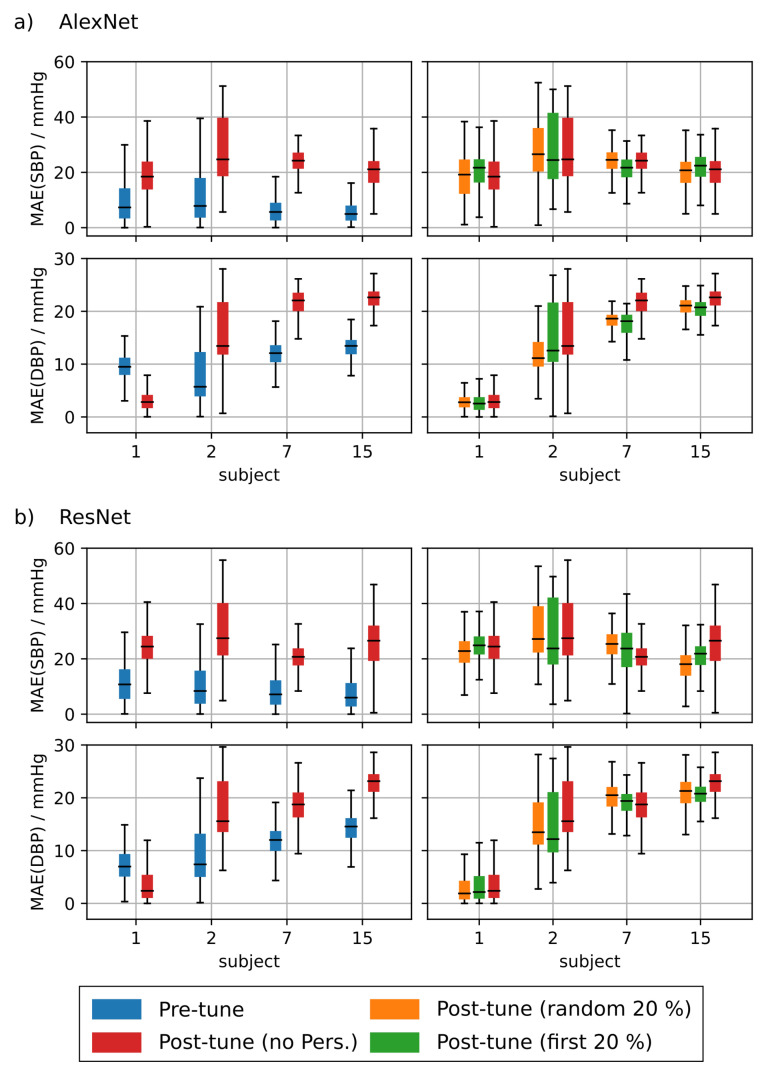
Figure A4.
Left: Mean absolute error (MAE) of subjects that did not show any improvement before vs. after fine tuning using remote photoplethymographic (rPPG) data for most of the architectures tested. Right: Comparison of the MAE for different personalization strategies using the first 20% of the test subject’s data vs. randomly drawn data for AlexNet (a) and ResNet (b).

