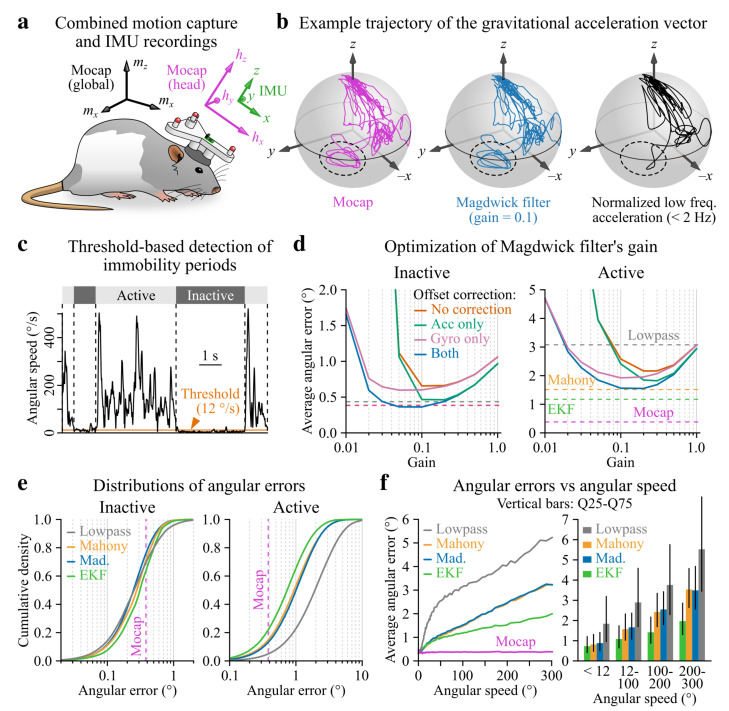
Figure 2.
Calculation of the accuracy of IMU-based head tilt estimation using concurrent 3D optical motion capture in freely moving rats. (a) Animals were equipped with a head-mounted 3D-printed support containing four IR reflectors for motion capture (here shown in red) and a wired IMU (wire not represented). (b) Example trajectories of the actual gravitational acceleration vector (motion capture, left), of its estimate calculated with the Madgwick filter (middle) and of the normalized low frequency acceleration (, right) over a period of 45 . The dashed ellipse highlights the region visited during a belly grooming episode. (c) Example angular speed trace (i.e., norm of the angular velocity vector) and corresponding periods of movement and immobility detected using a threshold of 12° s−1 (orange line; see Section 2.9). (d) Average tilt estimation error for the Madgwick filter plotted against the filter’s gain, during immobility (inactive, left) vs. movement (active, right) and with or without offset correction. Dashed lines represent the average error calculated with the best set of parameters for other filters as well as the uncertainty in motion capture data (see Section 2.6.3). (e) Cumulative distribution of tilt estimation errors for all IMU filters during immobility (inactive, left) vs. movement (active, right). The vertical purple dashed line represents the uncertainty in optical motion capture data. (f) Tilt estimation error plotted as a function of the angular speed (left) and median error values and interquartile intervals calculated by bins of angular speed (right). Motion capture error was also plotted to confirm that the uncertainty in the optical estimation of tilt did not increase for specific ranges of angular speed (e.g., due to high intensity movements such as grooming occurring predominantly in conjunction with specific head orientations inducing marker occlusions).

