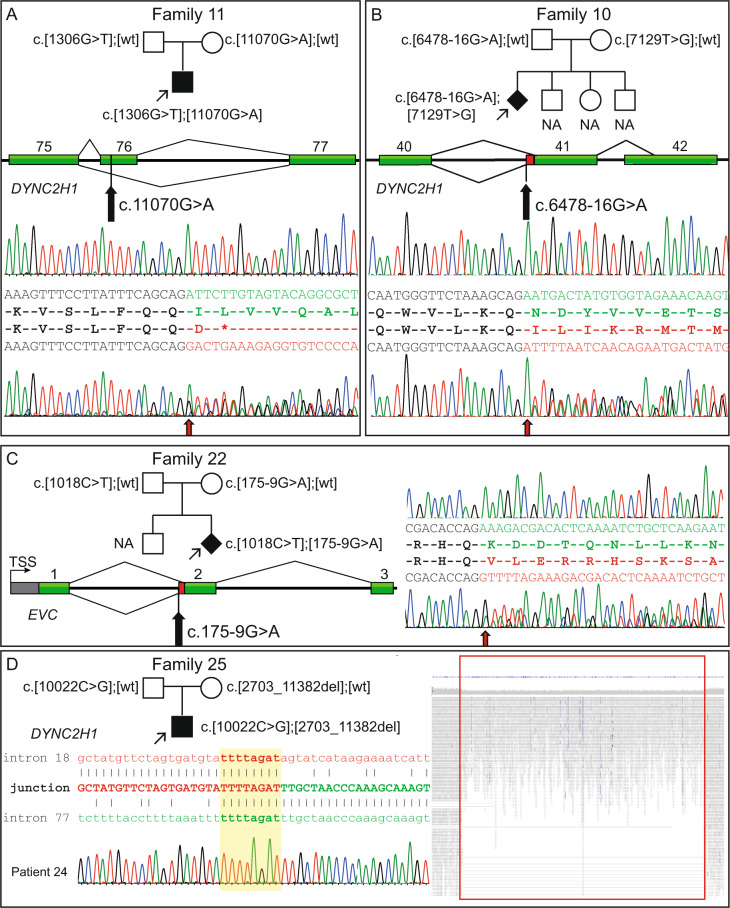
Fig. 4.
Molecular features of splice variants in DYNC2H1 (NM_001080463.1), EVC (NM_001306090.1) and an intragenic deletion in DYNC2H1 and pedigrees of the affected families. A Family 11 showing segregation for the variants in DYNC2H1 and a schematic presentation of exons 75 to 77 of the gene. cDNA sequence from normal control individual (top) shows normal splicing pattern of exon 75 and 76 (in green), and from affected child (bottom) shows heterozygous skipping of exon 76 (in red), leading to a premature stop codon. At the start of the frameshift (red arrow) sequences of both exon 76 and 77 are visible. B Family 10 showing the segregation of the variants in DYNC2H1 and a schematic presentation of exons 40 to 42 of the gene. The red bar indicates extra bases added to the gene product due to the introduced cryptic splice site variant. cDNA sequence from a normal control individual (top) shows normal splicing (in green) at the exon-intron boundary of exon 41. Sequencing of the same fragment from the affected fetus (bottom) shows an insertion of 14 bp to the cDNA (in red) leading to frameshift and a premature stop. Red arrow shows start of exon 41. C Family 22 showing segregation of the variants in EVC (NM_001306090.1) and a schematic presentation of the beginning of the gene. The red bar indicates extra bases added to the gene product when a cryptic splice site variant is inserted. cDNA sequence from a control individual (top) shows normal splicing at the exon-intron boundary of exon 2 (in green). Sequencing of the same fragment from the mother (bottom), who is a heterozygous carrier of the variant, shows an insertion of 7 bp to the cDNA (in red) leading to a frameshift. Red arrow shows start of exon 2. D Pedigree of family 25 showing the segregation of the variants in DYNC2H1 and a schematic presentation of the breakpoint junction between intron 18 and 77. Highlighted in yellow is the 8 bp microhomology and Sanger sequence trace from the affected child over the breakpoint. Reads and coverage of genome data in the deleted region from the affected child shows split reads and the drop in coverage over the intragenic deletion. bp, base pair; NA; not available; TSS, transcription start site; wt, wildtype

