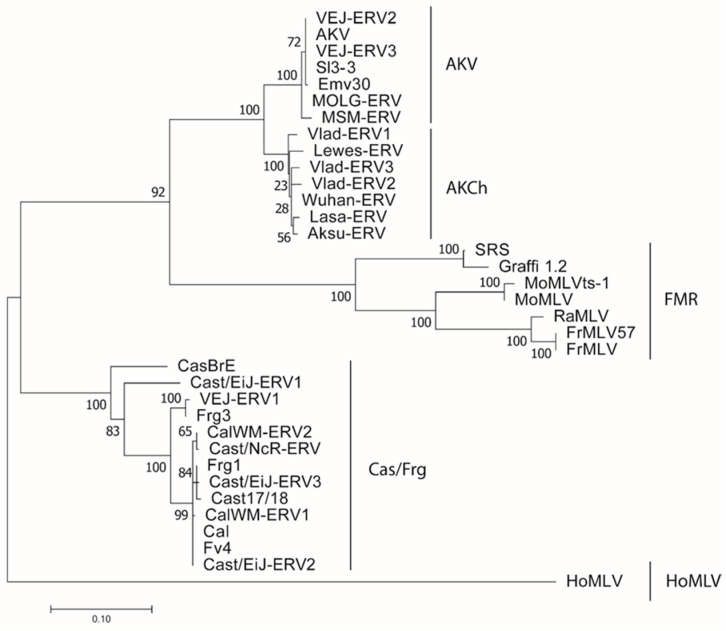
Figure 3.
Phylogeny of E-MLV env RBD sequences. Sequences corresponding to the RBD of the indicated E-MLVs were aligned and a maximum likelihood tree was generated using RaxML with 500 replicates. Bootstrap values are shown at each node. The tree was midrooted. Lines on the right side of the tree identify the five E-MLV subtypes.

