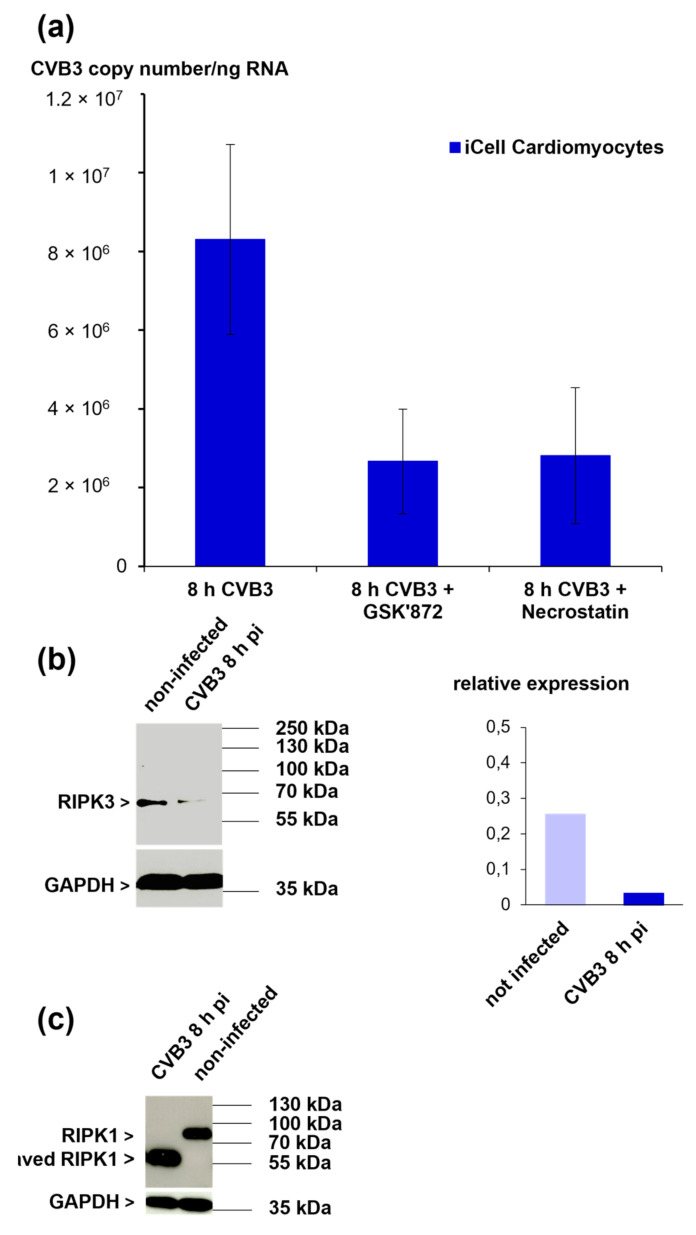
Figure 6.
(a) Quantification of viral load in iCell® Cardiomyocytes after inhibition of RIPK3 kinase activity (GSK’872) and inhibition of RIPK1 kinase activity (necrostatin). (b) Western blot analysis of RIPK3 expression in CVB3-infected iCell® Cardiomyocytes eight hours pi (MOI 10) (left panel). Densitometric analysis is shown in the right panel. Data were normalized to GAPDH. (c) Western blot analysis of RPK1 expression in CVB3-infected iCell® Cardiomyocytes eight hours pi (MOI 10).

