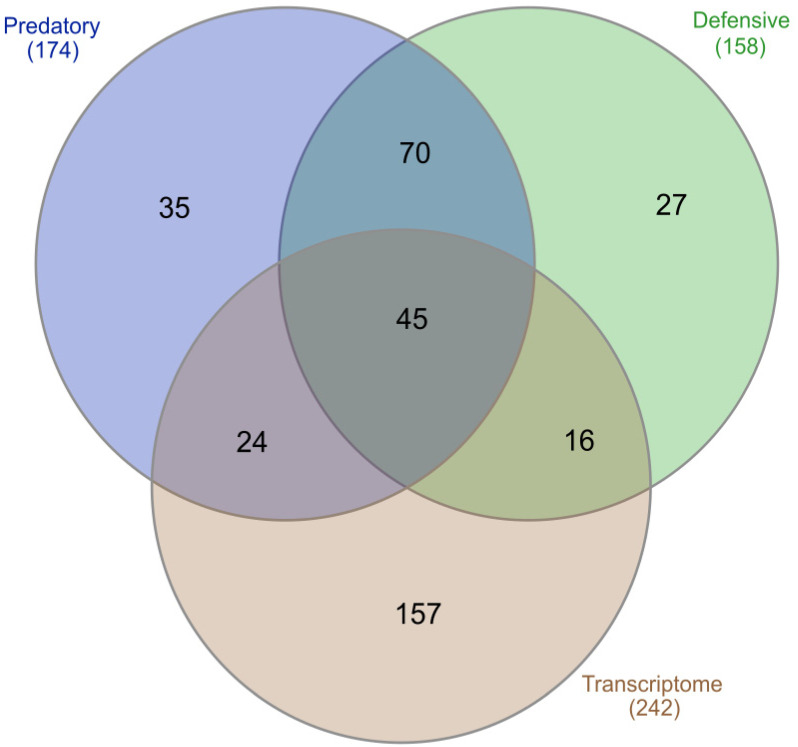
Figure 3.
Number of unique and shared proteins found in the predatory venom (blue), defensive venom (green), and transcriptome (brown). The number under the category name represents the total number of proteins annotated for each dataset. The Venn diagram was built by using InteractiVenn (http://www.interactivenn.net, accessed on 7 August 2021) [36].

