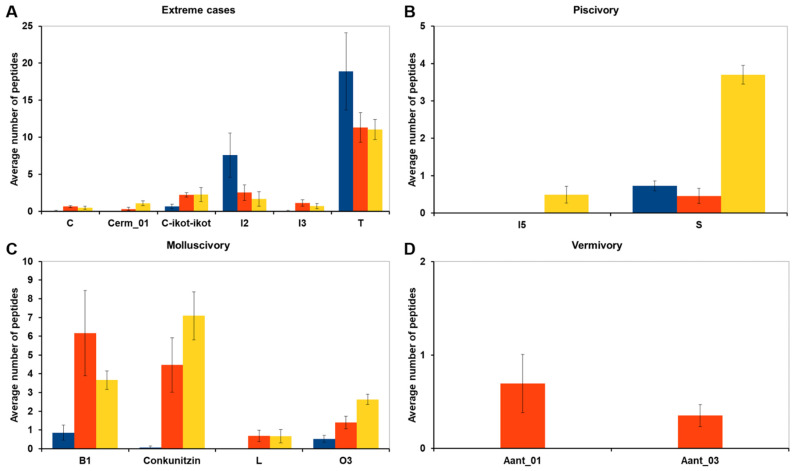
Figure 4.
Summary of the superfamilies whose abundance is statistically different among diets. The three diets are shown in blue (molluscivory), orange (vermivory), and yellow (piscivory). The bars represent the average number of peptides per diet, and the error bars the standard error on the mean. (A) The differences were statistically different only between the lowest and the highest abundances. In the other three panels, the abundance of each superfamily was statistically different in one of the diets respect to the other two: (B) piscivory, (C) molluscivory, and (D) vermivory.

