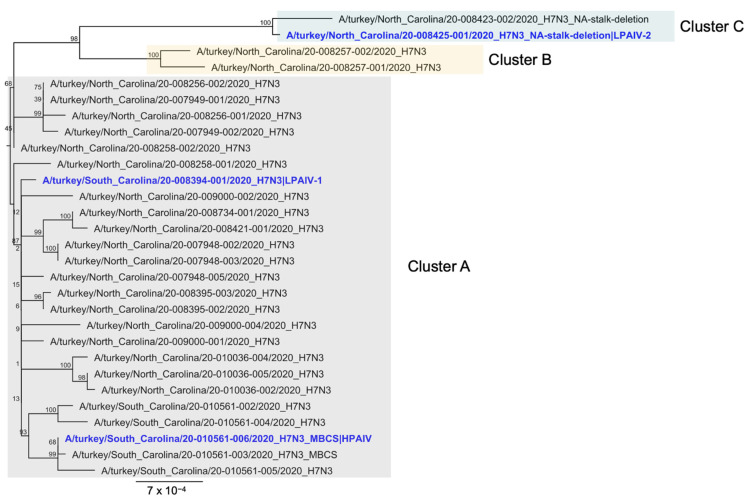
Figure 4.
Phylogenetic tree of H7N3 virus isolates from the 2020 H7N3 AI outbreak in North and South Carolina. The isolates used as inoculum in this study are depicted in blue. All eight gene segments from each isolate were concatenated and subsequently used to construct the phylogenetic tree. Adopted from a previous study [13]. MBCS next to the isolate name indicates that a multibasic cleavage site is found in its HA gene. Bootstrap values are reported at the nodes. Scale bar unit is in nucleotide substitutions per site.

