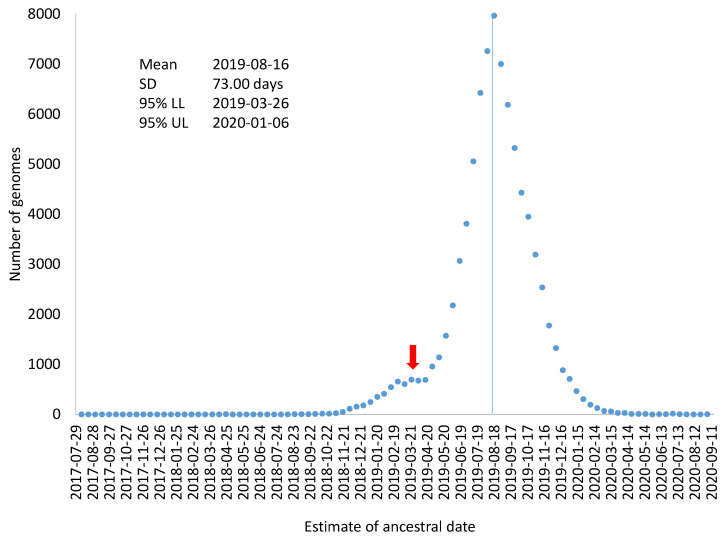
Figure 3.
Frequency distribution of TAi (=Ti − Di/μ) for characterizing variation in TA (the time for the origin of the common ancestor of the sampled SARS-CoV-2 genomes). The mean, standard deviation (SD), and 95% confidence interval are shown. The red arrow indicates the possible existence of another distribution, i.e., the distribution might be a mixture of two distributions.

