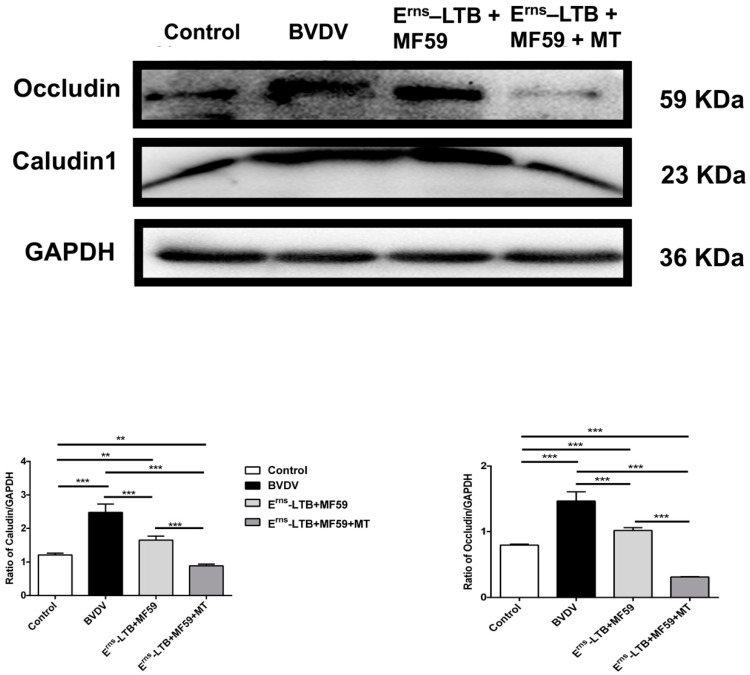
Figure 5.
Comparison of the claudin-1 and occludin expression levels in vivo. Relative protein expression levels were based on western blot band intensity; protein levels were normalized with GAPDH. Representative western blot image of claudin-1 and occludin expression levels in mice. The values in each column represent the mean ± SEM of three individual mice from each group detected in triplicate. ** p < 0.01; *** p < 0.001.

