Figure 2.
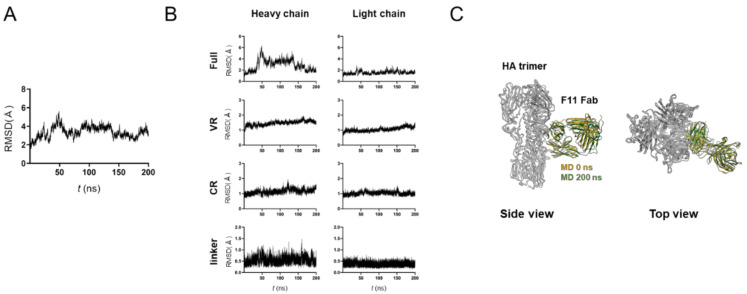
MD simulation of glycosylated HA trimer docked to the F11 Fab fragment. The top-2 complex was subjected to MD simulation at 1 atm and at 310 K in 0.15 M NaCl for 200 ns. (A) RMSDs between the structure of the initial HA-F11 Fab complex and those at the given time points of the MD simulation are shown. (B) RMSDs of structural units of the F11 Fab fragments during the MD simulations. The entire region (Full), variable region (VR), constant region (CR), and unstructured linker region between VR and CR (linker) are shown for the heavy chain (left panels) and light chain (right panels). (C) Superposition of the top-2 complex structures before and after 200 ns of MD simulations.

