Figure 6.
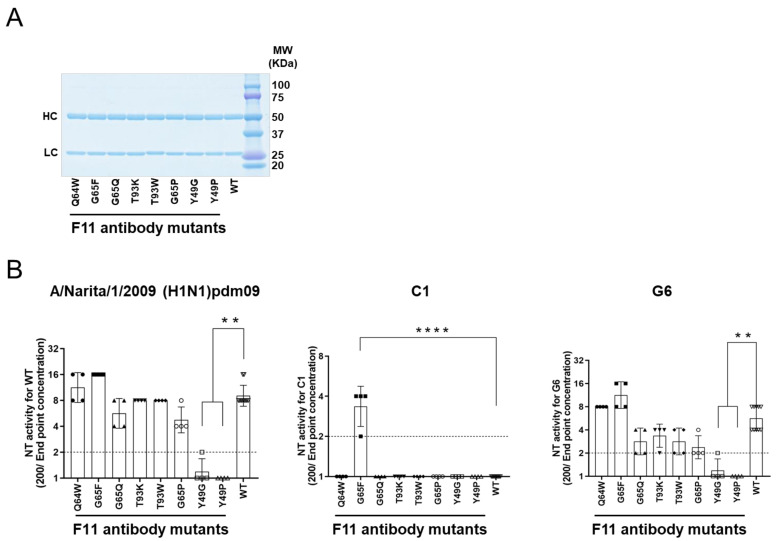
Experimental mutagenesis. Single amino acid substitutions were introduced into the Fab fragment of the F11 IgG1 antibody according to the information in Figure 5C,D. Affinity-purified soluble IgG1 antibodies were used to assess neutralization activity using humanized MDCK cells and 100 TCID50 of influenza virus as described previously [48,49]. Neutralization activity was defined as the reciprocal of the lowest concentration (µg/mL) of antibody at which A630 was >X as calculated using the formula X = (A cell − A virus)/2. (A) SDS PAGE of the purified F11 IgG fractions used for the neutralization assay. (B) Neutralization activity against the F11-sensitive (H1N1)pdm09 virus [18] (left panel), F11-resistant (H1N1)pdm09 variant C1 [18] (middle panel), and F11-weakly resistant (H1N1)pdm09 variant G6 [18] (right panel). NT activity is presented in the scatter plots as the geometric mean, with the geometric standard deviation from four technical replicates (except for F11 WT: n = 10). Y-axis values represent neutralizing titers, calculated as 100/minimum concentration (μg/mL) of antibody that neutralized the virus. Dotted lines represent the detection limit (y = 1; 100 μg/mL). ** p < 0.01 and **** p < 0.0001, comparing F11 mutants with F11 WT (Kruskal–Wallis test, followed by Dunn’s multiple comparison test). For statistical analysis, a provisional minimum NT activity value (y = 0.5; 200 μg/mL) was applied to samples in which NT activity was below the detection limit.

