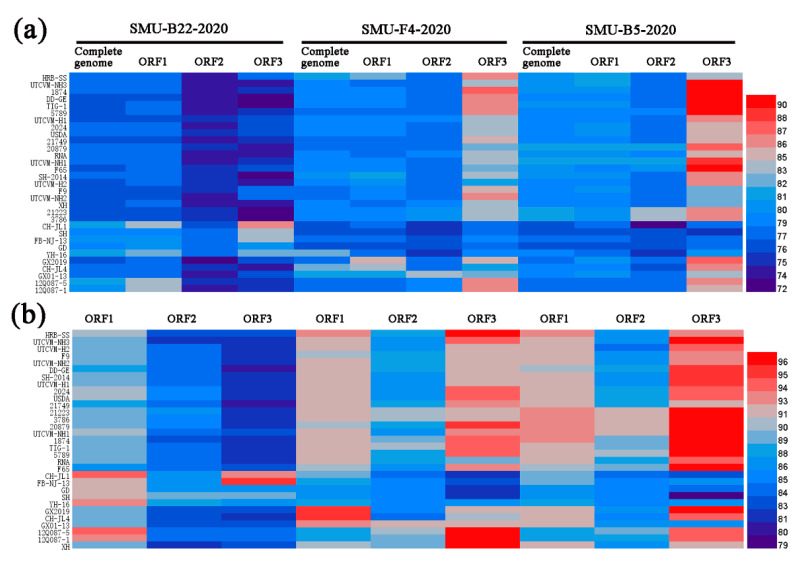
Figure 3.
A heatmap was constructed based on the nucleotide sequence (a) and amino acid identities (b) of each genome among different FCV strains using HemI software. The colors represent sequence identity (blue for lower identities and red for higher identities) among different strains. The bar on the right represents the hierarchical similarity among the 15 meta-clusters (metric, Euclidean distance; linkage, average).

