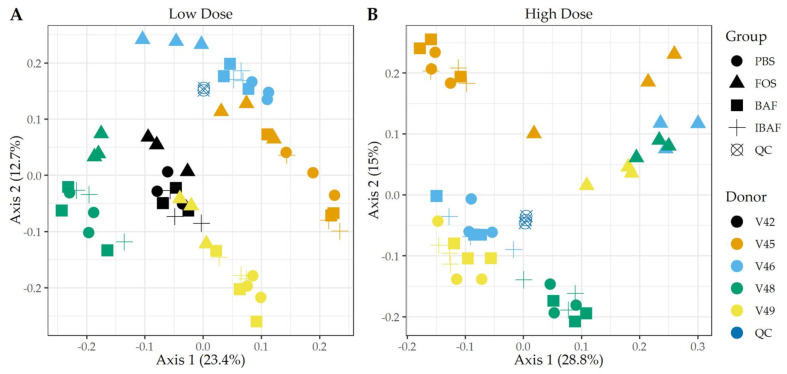
Figure 7.
Principal component analyses of clusters of orthologous groups (COGs) demonstrate the unique pattern of an individual’s functional metaproteomic profile and absence of BAFASAL® impact. Principal Component Analyses—COGs. Panels A,B show principal component analyses (PCA) using COGs per sample and for low and high doses, respectively. Colors indicate volunteer samples and shapes treatment as shown to legends on the right of each panel. Note: Only those COGs that have non-zero values in >50% of samples were used for analyses (Q50).

