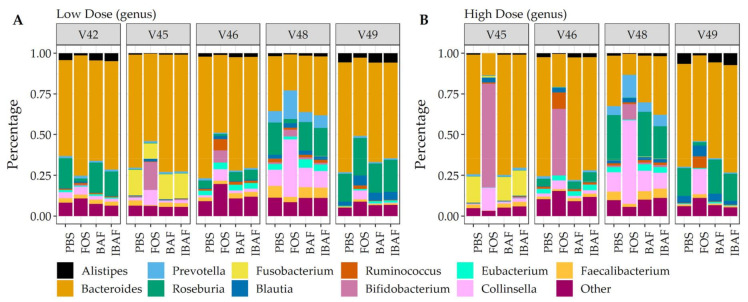
Figure 9.
Taxonomic analyses at the genus level demonstrates the unique composition of an individual’s gut microbiome via metaproteomic profiling and absence of BAFASAL® impact. Stacked bar representation from label-free quantification of protein groups assigned to genus (Panel (A), low dose, and Panel (B), high dose) expressed as percentages. Individual gut microbiomes are grouped, and the top 11 genus are identified by colored bars as indicated in key below panels.

