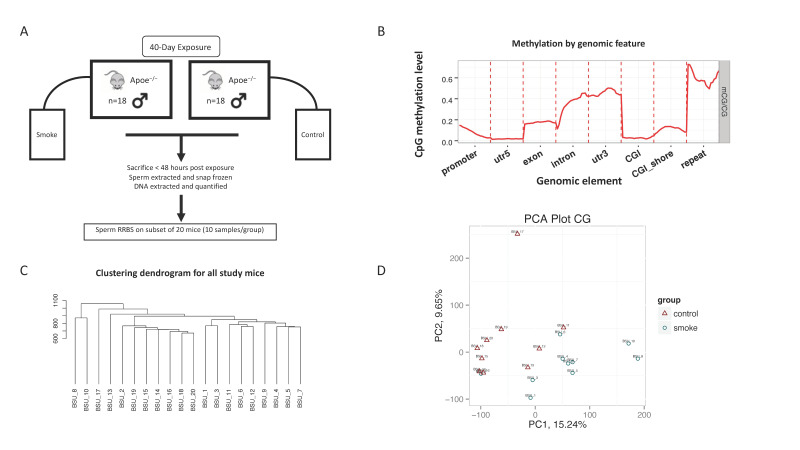
Figure 1.
Schematic of study design and DNA methylation characteristics. (A) Study design showing exposure group, study duration and health outcome of interest. (B) An example of the average methylation level distribution in genomic functional regions for one of the samples is shown to demonstrate general agreement with our understanding of methylation profiles (i.e., promoter methylation is relatively low, while repeat elements are highly methylated). (C) The dendrogram shows the hierarchical clustering of the study mice. (D) PCA plot for principal components 1 and 2. Panels C and D demonstrate the relationship between samples, which is mostly dichotomous by exposure group, where IDs “BSU 1-10” are exposed and “BSU 11-20” are control.

