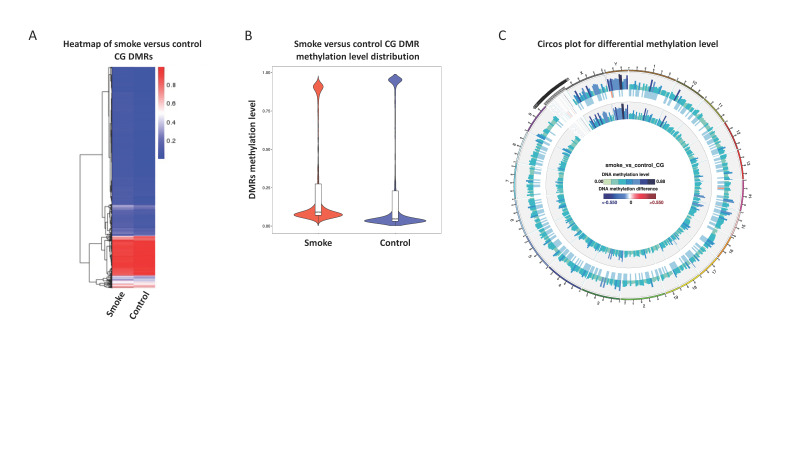
Figure 2.
Differential methylation of smoke-exposed versus non-exposed mice. (A) Heatmap of DMRs separated by exposure group and representing all 20 animals. (B) Violin plot showing average methylation level for DMRs separated by exposure group. (C) The Circos plot reflects the difference of the combined methylation levels of the exposure groups. Methylation of the smoke-exposed mice are around the outside and methylation of the non-exposed mice are around the inside. In between is the methylation difference between exposure group with blue denoting that the smoke-exposed mice have a more methylated profile and red denoting a less methylated profile.

