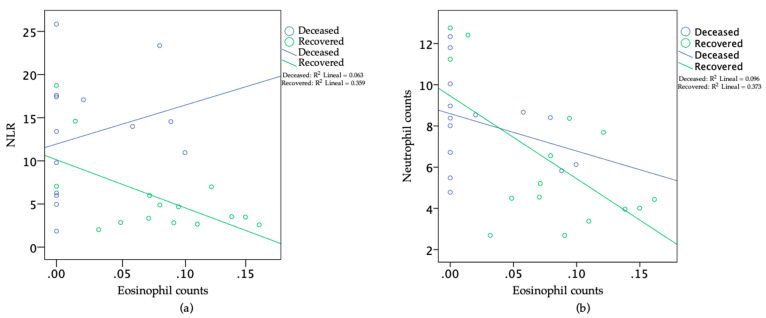
Figure 5.
Scatter plots of eosinophil counts (×109/L) against (a) the neutrophil-to-lymphocyte ratio (NLR) and (b) the neutrophil counts (×109/L) at Day 9 of onset of clinical symptoms for recovered patients (n = 15) and deceased patients (n = 14). Each NLR value or eosinophil/neutrophil count corresponds to a single patient.

