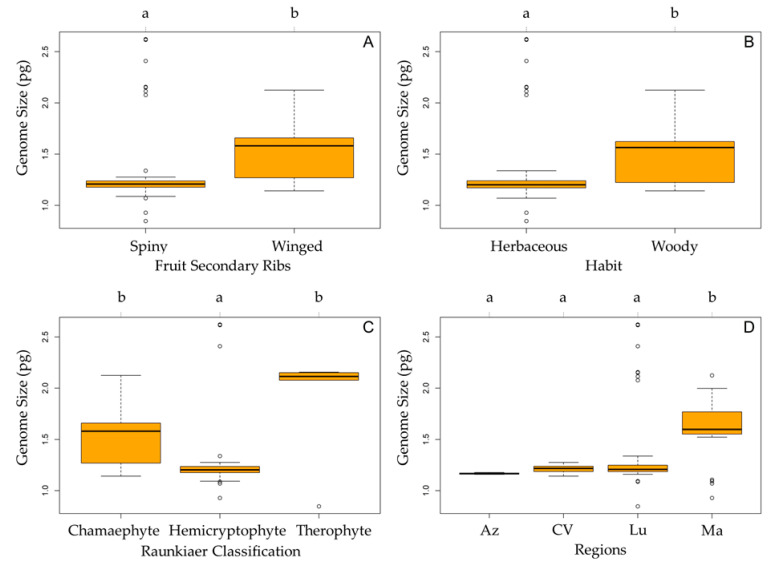
Figure 4.
Boxplot diagram showing the genome size variation for the studied Daucinae taxa according to (A) morphology of the secondary ribs (winged or spiny), (B) habit (herbaceous or woody), (C) Raunkiaer classification (chamaephyte, hemicryptophyte, or therophyte), and (D) regions (Az, Azores; CV, Cabo Verde; Lu, Portugal mainland; and Ma, Madeira). The orange box represents the 25th, 50th (median), and 75th percentiles, while whiskers represent the 10th and 90th percentiles with minimum and maximum observations. The dots represent the outliers. Different letters indicate significant differences between groups (p < 0.05).

