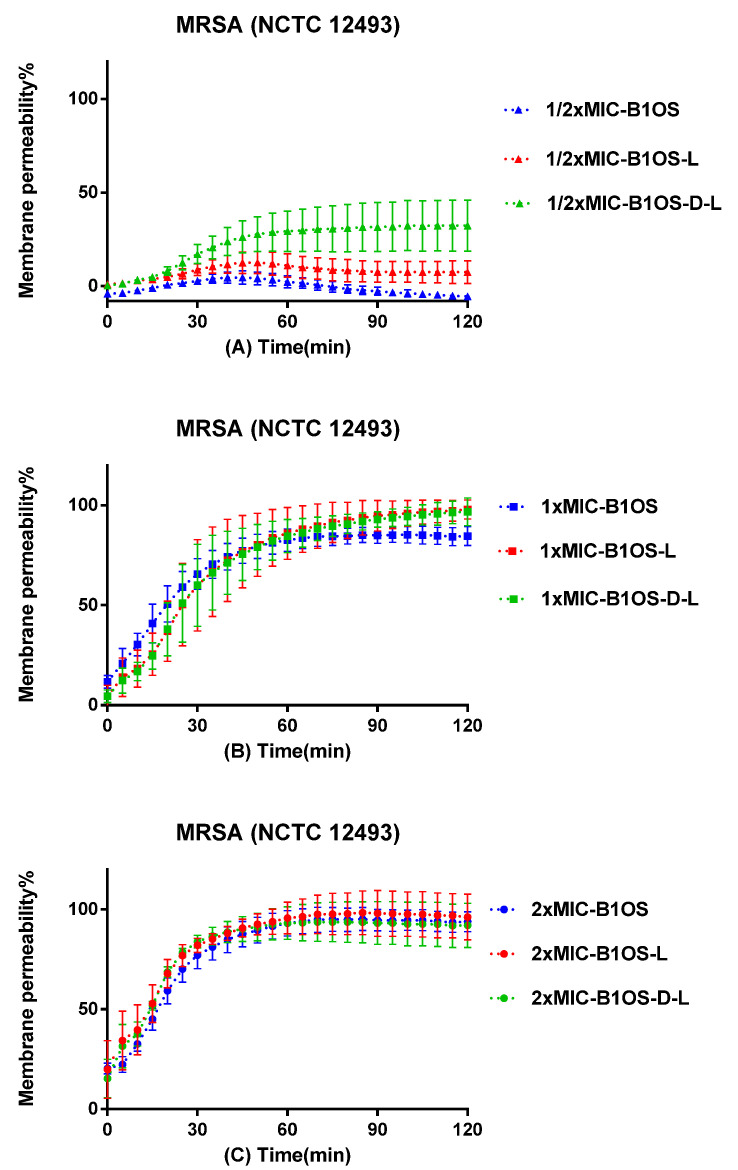
Figure 5.
Kinetic membrane permeability curves of B1OS (blue), B10S-L (red), and B1OS-D-L (green) at the concentrations of 1/2× MIC (A), 1× MIC (B), and 2× MIC (C). The fluorescence was measured every 5 min. The permeability percentage was obtained by comparing the fluorescence intensity of bacterial suspension treated with 70% isopropanol. Data were represented as the means ± standard deviation of three independent experiments.

