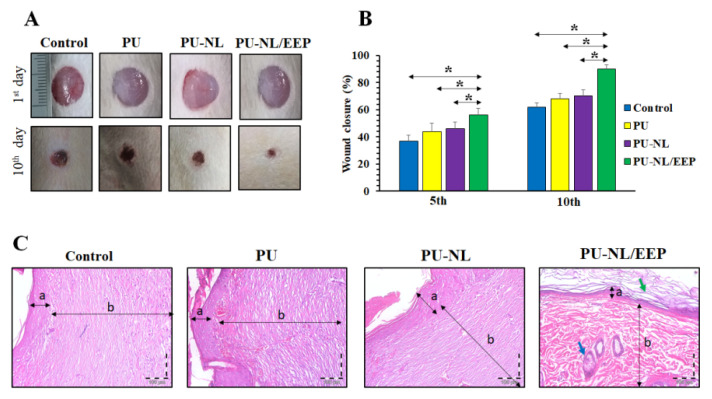
Figure 7.
(A) Macroscopic appearances of the wounds at the 1st and 10th days post-operation at the PU, PU-NL, and PU-NL/EEP groups. (B) Histograms of the wound closure progression of the PU, PU-NL, and PU-NL/EEP groups. The data are expressed as mean ± standard deviation, (n = 8, *: p < 0.05, ns: not significant). (C) H&E stained sections of skin specimens from the wound site of the PU, PU-NL, and PU-NL/EEP groups. Two-head arrows indicated by a and b letters indicate the epidermis and dermis layers, respectively. Also, the green and blue arrows indicate the keratin layer and sebaceous gland, respectively.

