Figure 1.
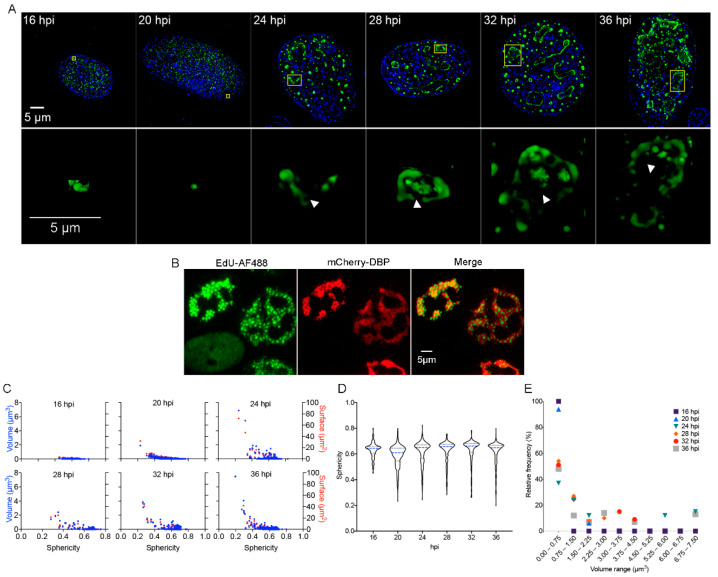
DBP-positive RCs resemble BMCs as they increase in size and shape complexity and appear increasingly subcompartmentalized with progression of the replication cycle. (A) HFF cells were infected at a MOI of 30 FFU/cell with HAdV5 WT and fixed at the times indicated. Cells were imaged by acquisition of Z-stacks as described in Materials and Methods to study the intranuclear distribution of DBP by indirect immunofluorescence using the B6-8 primary antibody and anti-mouse Alexa Fluor 488-IgG secondary antibody. Mock-infected cells were included and are shown in the Supplementary Materials. (A-upper panels) Images from whole cells are presented as deconvoluted maximum intensity projections of DBP (green) and DAPI (blue). (A-lower panels) Insets show a 2D perspective of 3D reconstructions generated from the corresponding Z-Stack (indicated in yellow boxes in the upper panels) that illustrate the increase in complexity of DBP-assemblies with progression of the replication cycle. The arrowheads point to subcompartmentalized, hollow DBP-assemblies. The images were extracted from Supplementary Movies S1–S6. The color palette corresponds to the pixel gray level intensity under the Lookup Table Green (Fiji). (B) HFF cells were infected with the mCherry-DBPv virus, incubated with EdU at 20 hpi and fixed 8 h later, as described in Materials and Methods. A copper (I)-catalyzed click reaction was performed to conjugate EdU with Alexa Fluor 488 dye (AF488) to stain the sites of accumulation of newly replicated viral DNA. Note that the non-infected cell (absence of mCherry-DBP signal in the lower left corner) has a diffuse staining for AF488 compared to the foci distribution in infected cells (mCherry-DBP positive). (C) Dot-plots comparing the volume (blue dots) and surface (red dots) as a function of the sphericity index of DBP-assemblies at different time-points. (D) Violin plots of the sphericity index as a function of different time-points. The sphericity index ranges from 1 (perfect sphere) to 0 (non-spherical). (E) Dot-plot representing the relative frequency of DBP-assemblies grouped in different volume ranges for each time-point.

