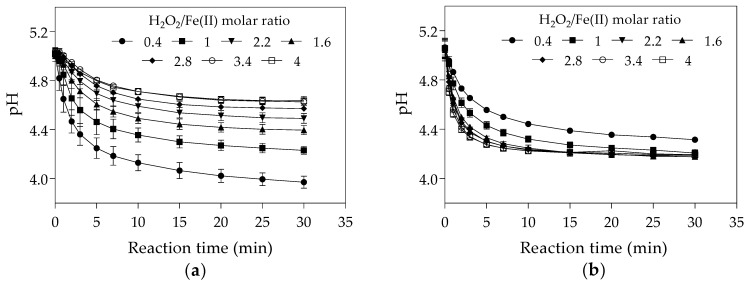
Figure 2.
pH-time profile during Fenton oxidation under different H2O2/Fe(II) molar ratios. (a) The first set of experiments was conducted with initial H2O2 concentration of 25 μM and initial Fe(II) concentrations from 6.25 to 62.5 μM. (b) The second set of experiments was conducted with initial Fe(II) concentration of 25 μM and initial H2O2 concentrations from 10 to 100 μM. (The values presented are averages of three replicates, and error bars indicate the standard deviation).

