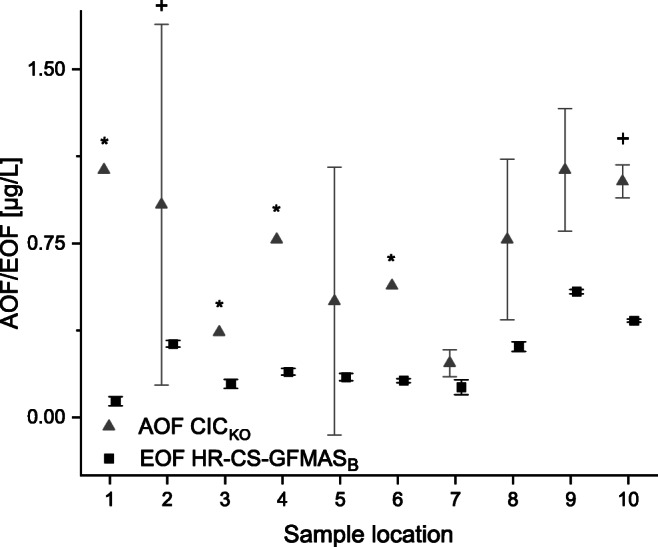
Fig. 7.

Comparison of EOF determined via HR-CS-GFMASB (square) and AOF determined via CIC (triangle). Means of methodical triplicates are shown; error bars refer to n = 2 and n = 3 ± SD (methodical triplicates). The mean CRM (diluted 1:1 with methanol) fluorine concentration was 56.35 μg/L (acceptable according to the manufacturer). For sample locations, refer to Fig. 2 and Table 1. + One sample out of the triplicate was negative after blank correction. * Two samples out of the triplicate were negative after blank correction and hence not taken into account
